Volatility is set to return to equity markets amid rising yields
29th March, 2018
After fifteen months of equity markets grinding steadily higher, volatility returned abruptly at the beginning of February. Volatility – as measured by the VIX index – increased to levels last seen in 2015, when there were deep worries about the strength and stability of China. Although risk asset prices fell sharply, selected markets, such as US and Hong Kong, swiftly recovered much of the early losses. Over the month, the MSCI All-country World and Emerging market index lost 4.4% and 3.9% respectively.
Strong macro-economic data played an important role in preventing a more sizeable market correction. For the fourth quarter of 2017, US, China and the Eurozone showed robust year-over-year growth of 2.5%, 6.8% and 2.7% respectively. Leading indicators such as PMIs also dismissed the idea that a recession is imminent. However, we expect volatility is likely to remain elevated in the months to come, given the current key concern among investors that the continuous recovery will eventually cause major central banks to unwind their easy monetary policies and drive bond yields further upwards to levels that dampen risk-on sentiment for equities.
Be mindful of bear market signals in the coming months
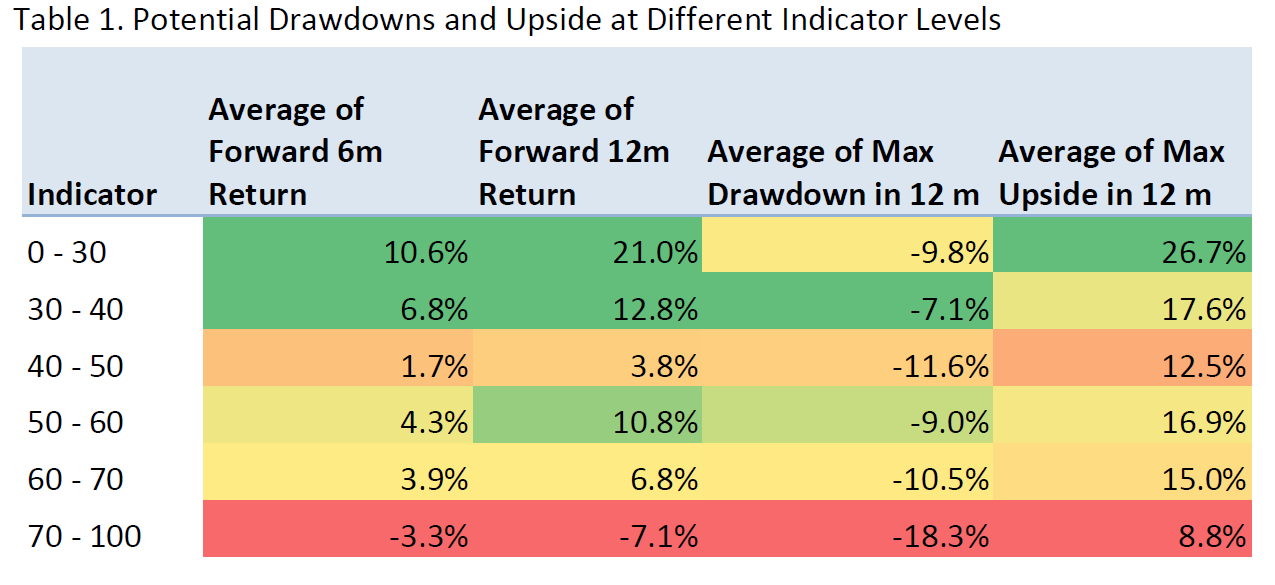
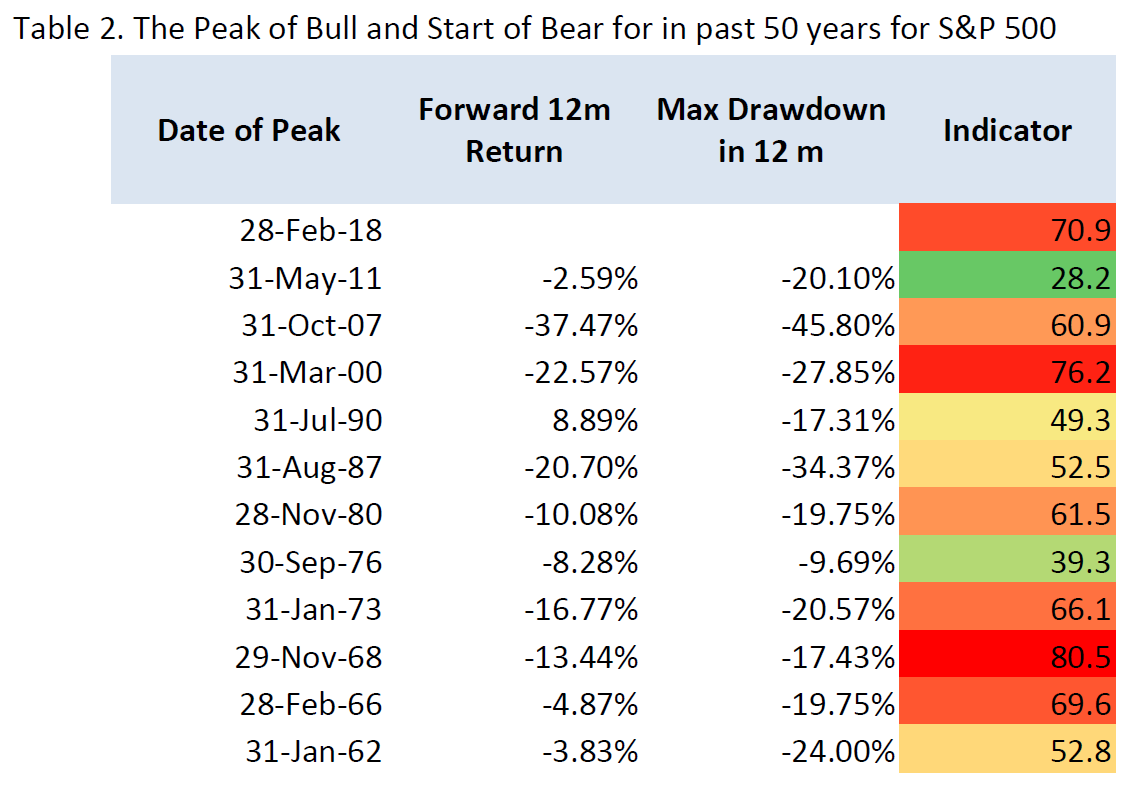
In the previous issue of insights, we examined the price actions of S&P 500 and Hang Seng Indices, and concluded that investors’ sentiment shall be dampened by the abrupt correction in early February in the short run (say 3 months), but there is still a substantial and increasing likelihood for both equity indices to reach new highs when the forward-looking period lengthens. In this issue, we are going to aggregate a number of fundamental factors that have close association with a bear equity market and to assess the current risk of further market correction. We study the bear markets of the S&P 500 Index in the past 50 years by using an indicator that takes into account of five factors, namely equity valuations by Shiller PE ratio, core inflation by CPI, business sentiment by PMIs, term structures by yield curve slopes and labor market conditions by unemployment rate. When the indicator is at an elevated level, the potential drawdown is significantly higher and further upside is relatively muted. As of 28-Feb, 2018, the indicator stood at 70.9, staying in the range where both the expected returns in 6 and 12 months are both negative. However, what looks less worrying currently is that US inflation remains subdue, enabling monetary policies to stay loose and stable for some time. Expansionary fiscal policies also support growth and make economic recession less likely in the short-run. Therefore we do not expect a sharp market decline, but low single-digit or slightly negative US market returns instead in the near term.